MRIP Q&A
In our August issue of Newscast, we asked readers for their
questions. We heard from Capt. Monty Hawkins, a charter boat
operator, blogger, and recreational fishing advocate, who sent us
two related queries. For the purposes of space, we've condensed them
below. To read the full text with his accompanying commentary, along
with his other posts, you can visit Capt. Monty's blog at
http://blog.morningstarfishing.com/
Question:
How can you say MRIP is "better" than MRFSS when there are still so
many estimates that appear to be obvious outliers? Specific examples
include:
-
Wave 2, 2010, New Jersey Shore Mode tautog catch.
The estimate was 483,198 pounds. That number is greater than the
TOTAL for-hire Wave 2, 2010, catch PLUS the total commercial
landings for the WHOLE YEAR.
-
Wave 3, Massachusetts Private Boat Mode black sea bass catch.
The estimate was 246,973 sea bass in Wave 3 alone. That number
is greater than the catch of the entire East Coast for-hire
fleet through Wave 3.
Where's the head-count? Where are the statistical stops to prevent
wild flyers in the data? Isn't there some way to clearly flag the
"bad" numbers and only report the ones that make sense?
MRIP Responds
Dear Capt. Monty,
Thank you for your questions. These are important issues with
complex explanations that straddle the line between the science of
producing estimates of recreational fishing activity, and the most
appropriate use of those estimates to fairly and sustainably manage
recreational fisheries.
On the science side, MRIP has implemented a number of significant,
peer-reviewed improvements to our previous recreational fishing data
collection program. The basis for these improvements is a 2006
review of MRFSS by the National Research Council (NRC), a leading
group of independent scientists. One of the chief concerns raised by
the NRC was that our catch estimation methods introduced the
potential for bias in our results. In statistics, bias can occur
when you make assumptions about your data that you haven't tested,
such as assuming that catch rates are the same during different
parts of the day.
The NRC recommended a number of specific changes to MRFSS to remove
the potential for bias from our estimates, which the MRIP team -
made up of NOAA representatives, state partners, outside
consultants, fishermen and other stakeholders - has systematically
worked to implement over the past several years. Complete details of
all our projects can be found at our website,
www.countmyfish.noaa.gov.
With these improvements in place, we can say with confidence that we
have enhanced the quality of our estimates. In fact, the cases you
cite are good examples for demonstrating exactly what we mean by
that. To begin with, it is important to recognize that when we talk
about an "estimate," we're actually talking about two numbers:
-
The first is the "Point Estimate," which is the number you refer
to in your question.
-
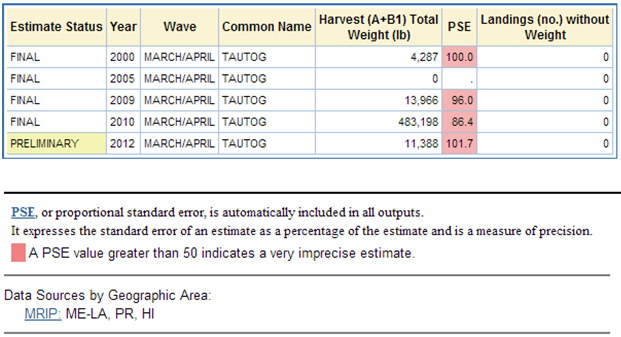
The second is the "Precision." In polling, this is often
referred to as the "margin of error." In our estimates, we use a
measure called "percent standard error" (or PSE). Precision
tells us how confident we can be in the point estimate.
For an estimate to have any real-world meaning, BOTH of these
numbers have to be taken into account. That's because if there is a
high PSE, then we are less certain that the point estimate reflects
the true value, a fact that has to be accounted for when using the
data. However, less precision is not the same as less accuracy.
Because we have removed the potential for bias from the way we
estimate catch, MRIP's new numbers - the point estimates combined
with the PSEs - are still a more accurate estimation of recreational
fishing activity.
In the tautog example you ask about, the PSE was a very imprecise
86.4. One of the reasons the PSE is so high for this species in this
mode is because we don't encounter many people catching them.
Because of the way that sampling and estimation work, there is a
good chance that the point estimate for any individual species and
type of fishing (mode) during a single two-month sampling period
(wave) may seem unrealistically high or low. Although it is
typically the high "outliers" that tend to get the most attention,
they must also be taken in context with the low outliers;
considering both is an important part of evaluating the bigger
picture.
As an example, the table below shows Wave 2/New Jersey/Shore
Fishing/Tautog Catch Estimates from 2000 through 2012. In nine of
those years, the estimate was zero tautog caught (PSEs cannot be
calculated for zero catch). In years where there has been reported
catch, the PSE is very high.
Both statistically and anecdotally, it is equally unlikely that zero
fish were caught during any given year as it is that there was a
35-fold increase in catch in 2010 over 2009. Therefore, what these
numbers indicate more than anything is that our samplers encounter
very few individuals catching tautog from the shore in New Jersey
during Wave 2.
To improve precision we would need to substantially increase the
size of our intercept sample, which would mean talking to
significantly greater numbers of anglers. That, in turn, would
significantly increase the cost of the surveys. As we discuss below,
this is certainly an option, but it must be weighed carefully
against all the other competing needs for those resources.
With regard to black sea bass, the PSE for Wave 3 in 2012 was 30.9.
This is far more precise, but there's still a fairly wide margin in
terms of the potential number of fish caught. It's also worth
pointing out these are preliminary estimates. Before they're
finalized, all of our estimates go through an extensive quality
control process, which includes a point-by-point data review with
the specific purpose of looking for collection errors.
This process is part of what we do to "flag" outlier numbers. In
addition to our own review, preliminary estimates are open to public
scrutiny so that individuals, such as yourself, can point out
numbers that should get closer scrutiny. We have also added new
features to our query outputs that highlight especially high PSEs,
which can be output as either graphs or tables.
As you note in the rest of your post about black sea bass, even if
these particular point estimates hold, as we begin to look at data
over a longer and longer time series, or across broader geographic
areas, the PSE declines and the point estimate becomes more precise.
(Readers can see the numbers for themselves and run their own
queries at
www.countmyfish.noaa.gov.)
This leads to the issue of how best to use the data that our surveys
produce, a challenge highlighted in the recent decision to close the
black sea bass fishery. (More information about the closure decision
is available from NOAA Fisheries' Northeast Regional Office (www.nero.noaa.gov).
As managers face new mandates to ensure that overfishing is not
occurring, we may find a greater need for more precise estimates
delivered more frequently for some species during some parts of the
year. Each of these needs has costs associated with it. Ultimately
the question of where the money will come from and how to spend it
is part of the dialogue that takes place among fisheries managers,
scientists, fishermen, coastal community representatives, and other
stakeholders. But the tools are being put into place to get the
information when it's needed.
In addition, the work to make our surveys even better - and to
anticipate the emerging needs and opportunities of the future - is
continuing. Numerous MRIP-funded studies are underway looking at
everything from how to improve survey response rates, to rethinking
how we count for-hire catch, to looking at ways to enable anglers to
submit their own data. As each study is completed, the findings are
incorporated into the overall program, making the process of
improvement incremental and ongoing.
In closing, we'd like to highlight three main points: -
The estimates we produce under MRIP represent a clear and
quantifiable improvement and we have confidence in their
accuracy, but point estimates always need to be considered in
the context of the margin of error.
-
We recognize that management sometimes has to occur at a finer
scale - either in terms of geographic area or time period - than
our estimates are ideally suited for. As we complete the
implementation of our fundamental design improvements, we will
work with managers, scientists, fishermen, and other
stakeholders to evaluate and prioritize investments in programs
to meet data user needs for finer precision, timeliness, and
geographic resolution.
-
MRIP is an ongoing process of making improvements and addressing
shifting needs. We know that the best way to improve the system
is through an open and interactive process. We appreciate the
attention of fishermen who care enough about the future of
recreational fishing to remain informed and engaged.
|